


One focus of my work at my day job this semester has been to make working online a little more manageable. I thought I’d share some of the tools I use to do this, as well as to have them here in case I need them later.
The past few semesters, a series of policy changes have made it hard to make things manageable, or to scale labour in a reasonable way. The administrators I deal with don’t really seem willing or able to recognize that online teaching can involve more time spent on stuff that we wouldn’t have to spend time on in offline classes, and all the sensible attempts I’ve made to try do this have resulted in my banging up against those aforementioned policy changes. Admin’s just trying to cover their backsides in case of an audit by the Ministry of Education, of course, but the net effect is that online classes have been less effective for students, less manageable for instructors, and less fun for everyone.
I think things have evened out a bit, though: I’ve figured out some ways to reconcile policy and sanity, in terms of the delivery of content to students. However, until now I hadn’t quite nailed down the kinds of tools I could use for the humdrum, paperwork-related side of things. Now, I’ve shaved many hours off the process. The following explains how I did it, and how you can too.
Attendance
There are a few ways one can take attendance in Zoom classes. The easiest, and the least reliable, is to do it as you would in an offline class: calling names and marking attendance on a paper. But students can duck out of a Zoom class far more easily than from an offline one, and it’s just as much of a time-waster as in an offline class.
For instructors who permit students to participate with cameras and microphones off, it’s a real challenge, and one solution is to make an announcement—at a different time on each lecture day—that anyone who wants to be marked as present must write “I’m here!” in the Chat within 2 minutes of the announcement being made. A student could game this—say, by writing a script that watches the chat and sends them a ping or message when more than five people type something in the space of 20 seconds—but frankly, most students can’t do that and won’t bother.
For me, though, I have students participate with cameras on, and microphones on as well when they’re in Breakout Rooms. That means I can know if my students are there or not. If a student had the gumption to log in and then scam the camera feed somehow, I’d catch it pretty quickly once they went into Breakout Rooms. That means I can use Zoom Reports to generate attendance logs.
Zoom Reports are, after all, pretty great! Depending where within Zoom you download them, they can provide either simple totals of hours for each registrant, or even a fairly detailed minute-by-minute accounting of who was where when.
That said… there are pitfalls to be avoided.
Pitfall 1 (And How to Avoid It)
The first issue is that students aren’t consistent in how they register for classes. If, like with most of my courses, you have class at different times of the day on different days of the week, you will quickly discover students register in ways that make automation a huge pain in the ass. They’ll use variant spellings of their name:
- Michael vs. Mike
- 김지민 vs. Jimin Kim vs. 지민김 vs. Jee-Min Kim vs…
… well, you get the picture. They’ll also use different email addresses even if you warn them to always use the same email address, or to use their school-issued email address. (Even if you tell them that they’ll be marked absent if they don’t follow the rule, they still do it.)
In one case, I had the same student sign up with four different email addresses (including his girlfriend’s email address!) and no less than seven—yes, SEVEN—variants of his name.
The first semester I ran a Zoom class, I was updating attendance records on a weekly basis, and… within a few weeks, I found myself very frustrated doing it. These inconsistencies made what could have been a two-minute job into more like an hour per class, per week.
Luckily, it’s easy to fix this first issue.
Customized Registration Options
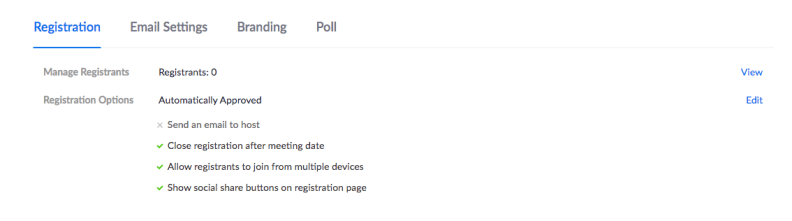
Zoom allows you to customize the registration information for students in your class. To access this, go to Meetings, click on a meeting from the set you’re adjusting, and then scroll down to the bottom of the page. You’ll see a Registration Options section, with an Edit link to the right of the screen:

Click on edit, and you get a few options:


Under Questions, you can change the name input options. If you’re dealing with Korean students, you’ll find they often are confused about what “First name” means, because the “first” name one gives in Korean is the family name. Worse, if there are two spaces for names, they will often either put their family name under first name, and their given (first) name under family name. Or they’ll put everything in one slot and a period in the other. Or they’ll write their name in both slots.
Happily, you won’t use this at all in your attendance spreadshheets. Instead, just delete “Family Name” and specify that students should write their given name in the “First Name,” in Roman letters (i.e. in “English”).
Then, click on Custom Questions and add one or both of the following:
- Student Number: This is how you will sort attendance records. Someone might mess up, but this will be less common by far than the chaos of names and email addresses.
- Full Name (in Korean): This is your fallback, in case someone messes up their student number.
Then, in your pre-semester announcement, explain that students need to Register for the Zoom meetings, and explain these options clearly so that they know how to fill out the questions.
Pitfall 2: Separate Zoom Records
The next thing you need to do is collate your Zoom records. Zoom allows you to download files in a few different formats, but the one you want is the .csv (Comma Separated Values) format.
The reason for this is that you can combine CSV files easily using the command line. If you’re on Windows, you can do that too, but I’m on a Mac and I do it this way: after dumping all the CSVs for one class into a folder, I open the terminal and use the following two commands:
cd /path/to/the/folder/containing/your/csv-files/
cat *.csv >combined.csv
This will create a new file in the same folder, titled “combined.csv,” containing the full contents of all the .csv files in the folder.
Since I work in Google Drive/Docs, I rename and combine the combined.csv file for each class to its folder, and then open it in Google Sheets. Immediately, Google Sheets gives me the option to remove duplicate entries, of which the only entries are header of the csv file. I go ahead and do that.
Before outputting a pivot table, there’s one thing I need to do—to make sure that there’s a column with the date for each entry, which is just a date and doesn’t include login times. (There are two kinds of Zoom Reports: one type contains only dates, the other tracks date-and-time for entry into and exit from the main class and—from what I can tell—Breakout Rooms too.)
The first kind is easier to work with: it has dates and total minutes for the session for each participant. However, it’s easy to use a function like ROUND or TRUNCATE to get a column with dates online into your sheet.
Next, you just have to build a pivot table, with Student Numbers as the Rows, Dates as the Columns, and minutes as the values. Then grab that pivot table, copy and paste the values into a new worksheet, and grab the line containing your records and drag it down to the bottom of the table.
In my case, there are certain sessions where prerecorded videos are used as a substitute for live classes on certain days. (For example, we have an extended exam period with mandatory discontinuous classes during the week when we don’t hold the exam.) It’s important to make sure that information is added, generally by exporting the video viewing logs from our campus LMS and adding the information to the table, adding one column per “substitute” class date.
It’s important to get that step done first, because in the next step you’re going to calculate total, overall attendance. The easy way to do this is to make a second, matching table (on another worksheet, or just further down the page on this same one. Copy the header and first row for the original table, and then calculate the values based on the comparison between the student’s time in class and your own. If you want to get fancy, you can mess with rounding rules. In the end, you’ll end up with a chart of numbers. I go with 1s for “Attended,” 0s for “Didn’t Attend” and that’s it. You could add in 0.66 for “Late” or something, or just use a percentage of classtime, if you count three lates as an absence.
(That said, most universities want attendance reported in terms of number of classes attended and/or missed, so I just use a binary marker for attended/missed.) This combined table can be submitted as your attendance record or, if your admins are sticklers, used to fill out the official attendance tracking form.
A simple SUM calculation will output the number of classes attended for each student. This is the point when it’s easiest to manually adjust for official excusal forms—the kinds of hospital trip receipts and other notes students submit in order for excusal for missed classes.
In the end, you’ll have a single column with attendance numbers, easy to output, and you’ve never had to think about it all semester. Just copy the student numbers column over and you’ll be able to sort it when you combine it with the rest of their grade records.
Pitfall 3: Participation Tracking
In my classes so far, I’ve tracked attendance. I’d rather not: it feels a bit babysitters’ club to me, but in a mandatory English class both carrot and stick come in handy.
How, though, can one track participation effectively?
Working in a spreadsheet is a pain, and I didn’t like it. I ended up taking a tip from a friend and creating a templated .docx file in Google Drive for each class meeting (or sometimes a few, for different breakout room sessions where there are multiple ones in the same meeting). Each docx has a few simple headings:
TERRIBLE
POOR
OKAY
GOOD
EXCELLENT
I snap images of the student groups and then drag-and-drop them into the docx files, each under the most appropriate header for the group. (On occasion, if one individual is a lot better or worse than the overall group, they can be placed in a different category.)
This leaves me with between twenty to forty documents with one data point for each student. This… can’t really be streamlined: collating the information manually is the only way.
But the question for me was how to collate the information quickly and easily. For this, I took inspiration from one fo the faculty where I work, who uses printouts of the “Students Enrolled” photo sheet available on our campus website. I saw him writing participation notes directly onto one of these sheets once, and marveled: the sheets are a bit hard to write on, since students often wear dark clothing in the images.
However, I was able to create a file in GIMP and import the PDF files with my students’ photos in it. I added a couple of layers: one was blank, white, and semi-opaque: This overlay made it easier to write over students’ faces, while still seeing them clearly enough to recognize them.
The other layer consisted of grids overlaid over their faces, so that I could collate the participation data directly.
![]()

Here’s a copy of the XCF file I used to create it. (This prints as a black-and-white file, which is even easier to write on top of.)
From here, it’s a simple step to collate the information. (I did this on my iPad, using a stylus: red dots made a good balance between visibility and not blocking out the faces. That said, it’d be even easier to do it class by class or weekly: that would remove the collating step, and it’s no more effort, assuming you have a tablet to work on and save the files onto.)
From there, it’s a quick bit of data entry at the end of the process, and then you’re done.
Pitfall 4. Converting Malformed Video Viewing Data
This one’s probably not a common issue, but it’s one I face: whoever coded the grading system and grade output for our campus’ Blackboard system didn’t bother to get the formatting right. something’s missing the syntax of all the tables, which means it’s not possible to the automated collation tools available in Excel. (At least, not Excel for Mac.)
For exported grading data, this isn’t an issue: one simple table with an incorrect ending isn’t a problem.
However, for those classes where I use a number of Supplementary Videos, the way the campus system is built, I need to export their individual records. There’s no option for a csv format export: only Excel is possible, and it’s badly formed in a way that prevents Excel from combining the files in a single, simple step. (Of course it is: welcome to South Korean campus IT standards…)
This means I need to upload the broken xls files to Google Drive, open them individually, and download them as csv files. After that, it’s the same process as for Zoom records: output a pivot table and then use as desired. (I paste mine to the right of attendance records and then apply selected dates as the replacement for the lectures they replace.)
All of this sounds like it’s complicated and lengthy, but in fact it has reduced the amount of time I had to spend on class-related paperwork. The thing is: this is almost all simply automation that reduces repetitive, mindless work. I don’t mind doing work that requires concentration or thought, but mindless data entry is a waste of time, especially when it can be done by machines instead. For me, it’s really helpful and totally worth the effort.